Use left/right arrows to navigate the slideshow or swipe left/right if using a mobile device
Choosing a selection results in a full page refresh.
Press the space key then arrow keys to make a selection.
Shopping Cart
Double click on a word to see the definition.
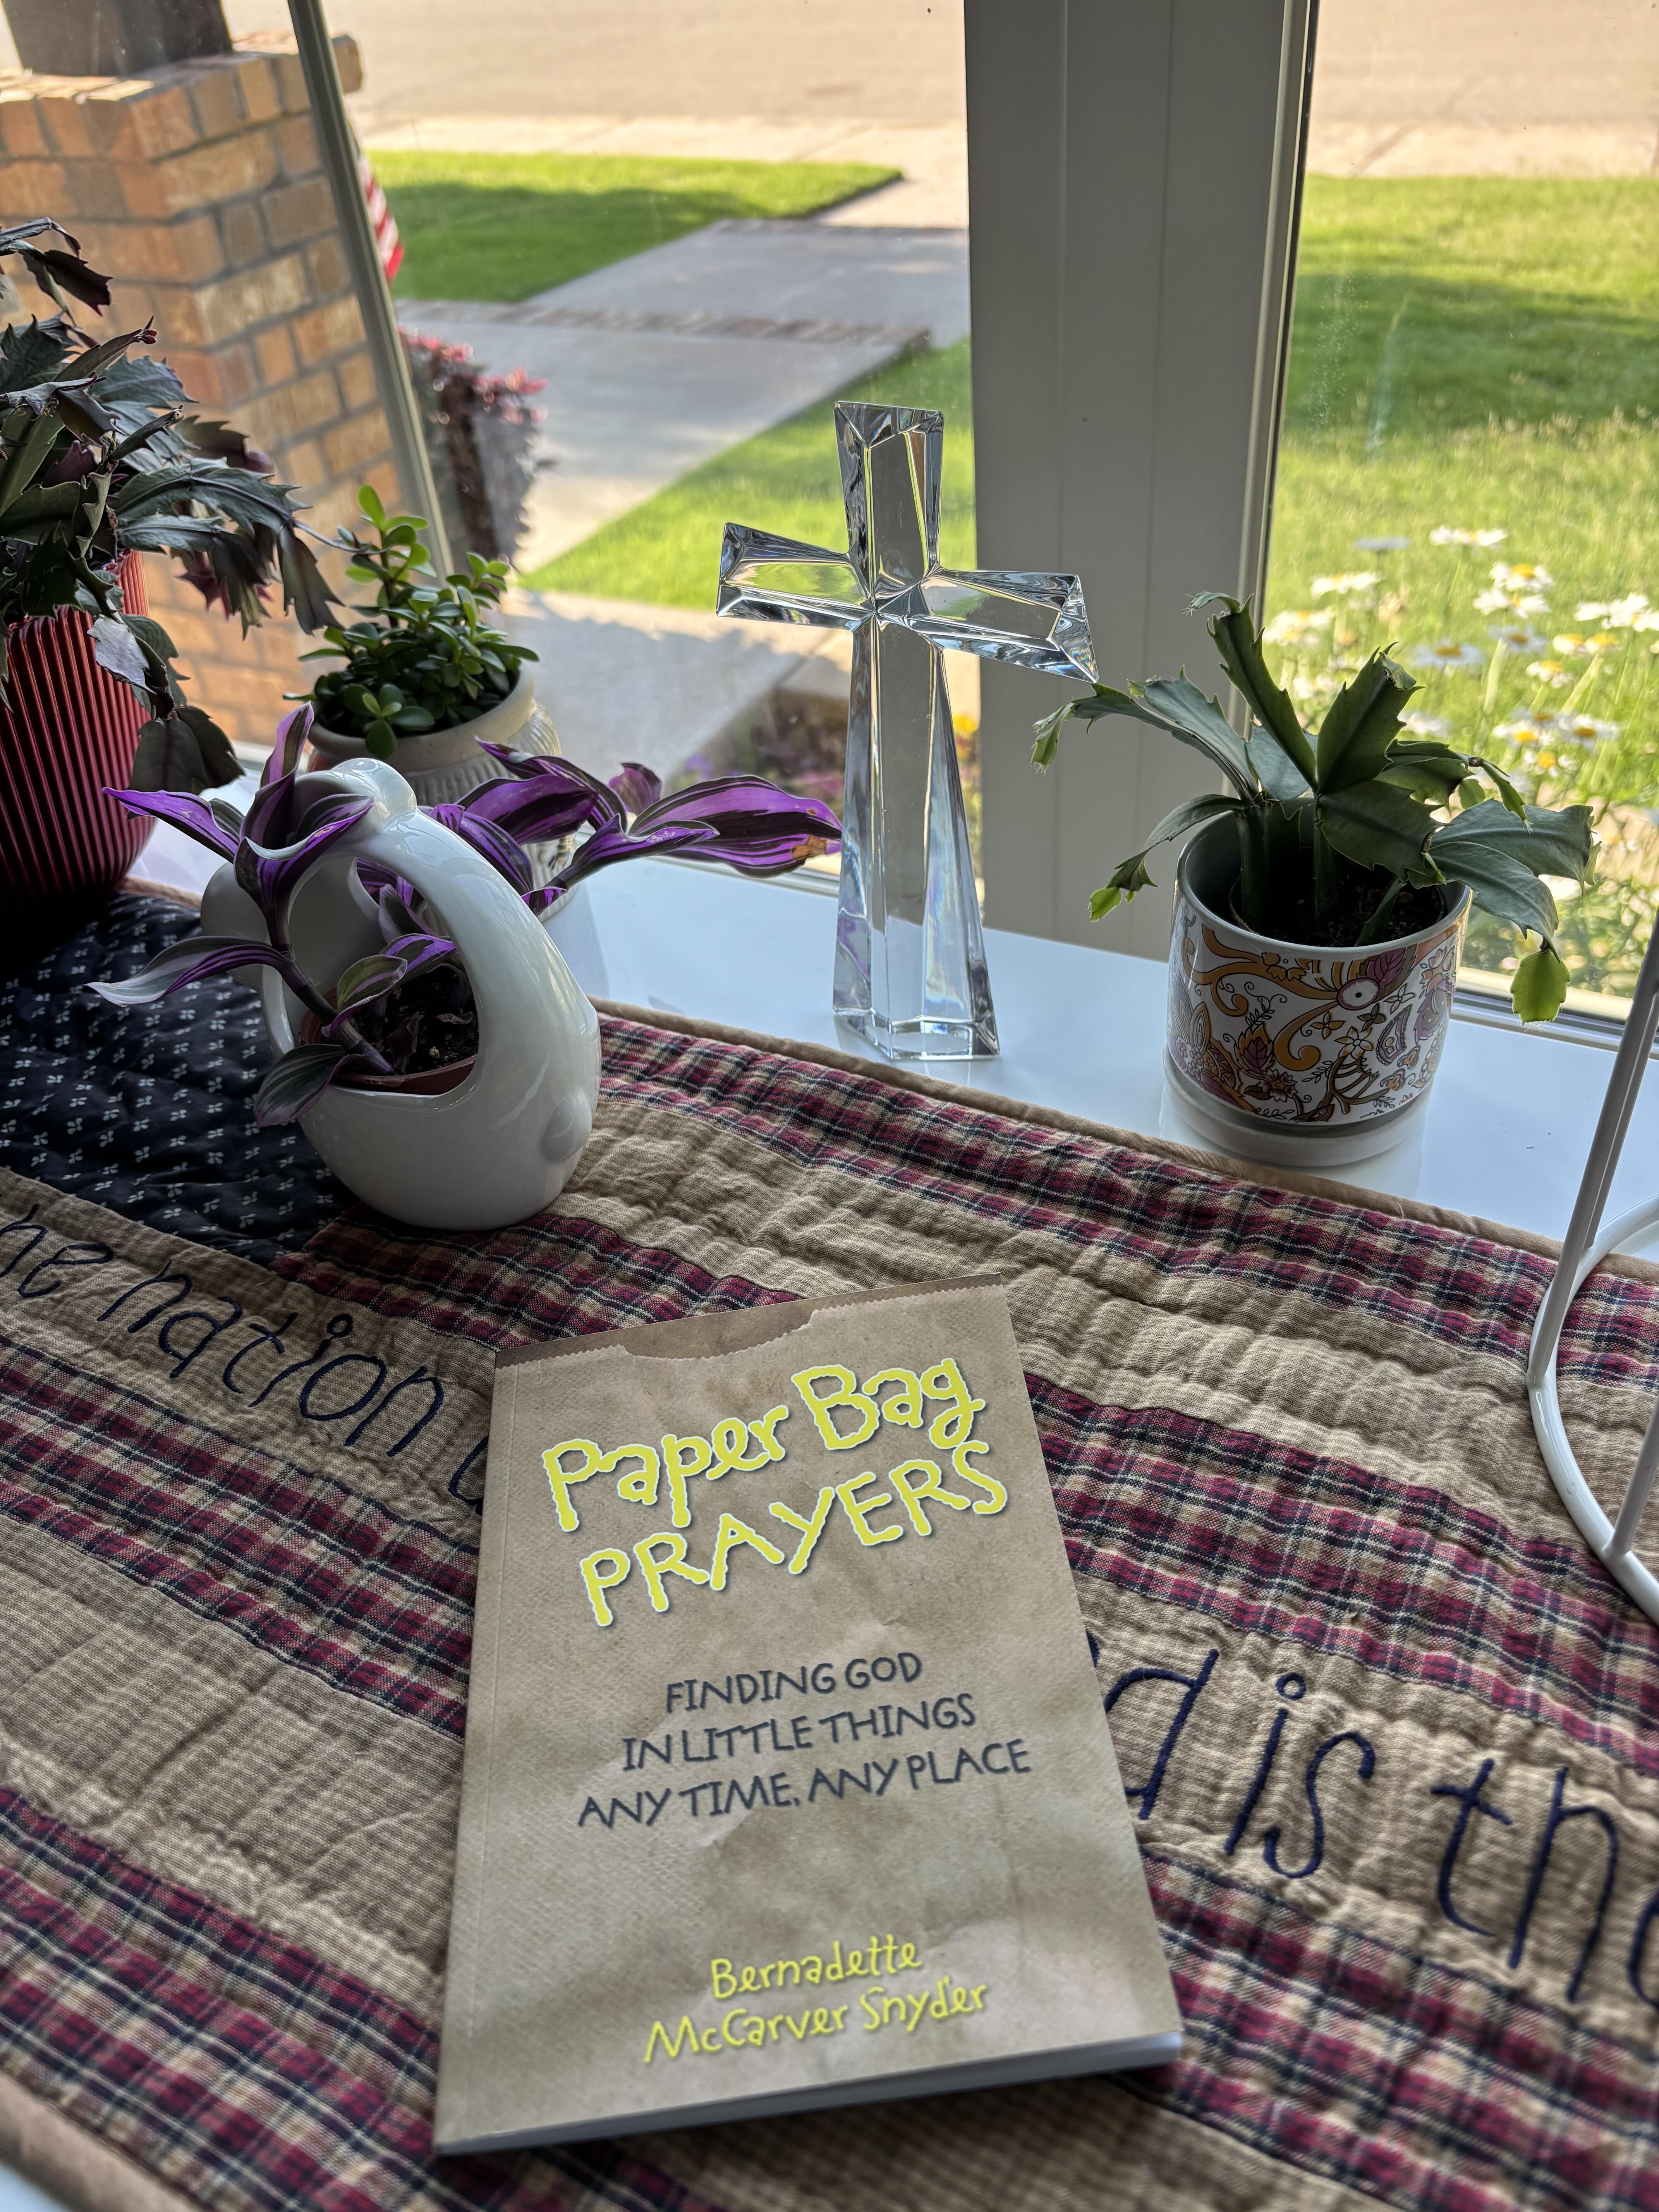
Judy
Wonderfully simple, powerful!
A small yet very thoughtful devotional book. A beautiful way to promote seeing God everyday in everything.
Paper Bag Prayers: Finding God in Little Things: Any Time, Any Place - Paperback
Gustavo
Está perfecto con muchas páginas para dibujar
Graffbook. the Graffiti Sketchbook - Hardcover
Lillian
Llego bien gracias.
Arcángeles: Miguel, la protección y los códigos angelicales secretos - Paperback
Lillian
Llego bien gracias.
Limpieza Espiritual: Secretos De La Limpieza Del Alma De Los Que Nadie Habla Y Cómo Limpiar La Energía Negativa De Tu Casa En 7 Días - Paperback
Martha
Love it! Shipped quickly, in good condition! Reasonable price. Giving as a gift to my daughter’s boyfriend who is a gifted reader and loves Diana Gabaldon “Outlander” series books. Thanks for your service!